Unicode plotting tool for displaying CSV data directly in your terminal
Using apply leads to implementation limits in the number of arguments which are fairly low. Refactoring everything as folds allows to handle an arbitrary number of datapoints. |
||
|---|---|---|
| images | ||
| uniplot | ||
| .gitignore | ||
| build.ss | ||
| gerbil.pkg | ||
| LICENSE | ||
| README.org | ||
| uniplot.ss | ||
Uniplot
Unicode plotting tool for displaying CSV data directly in your terminal.
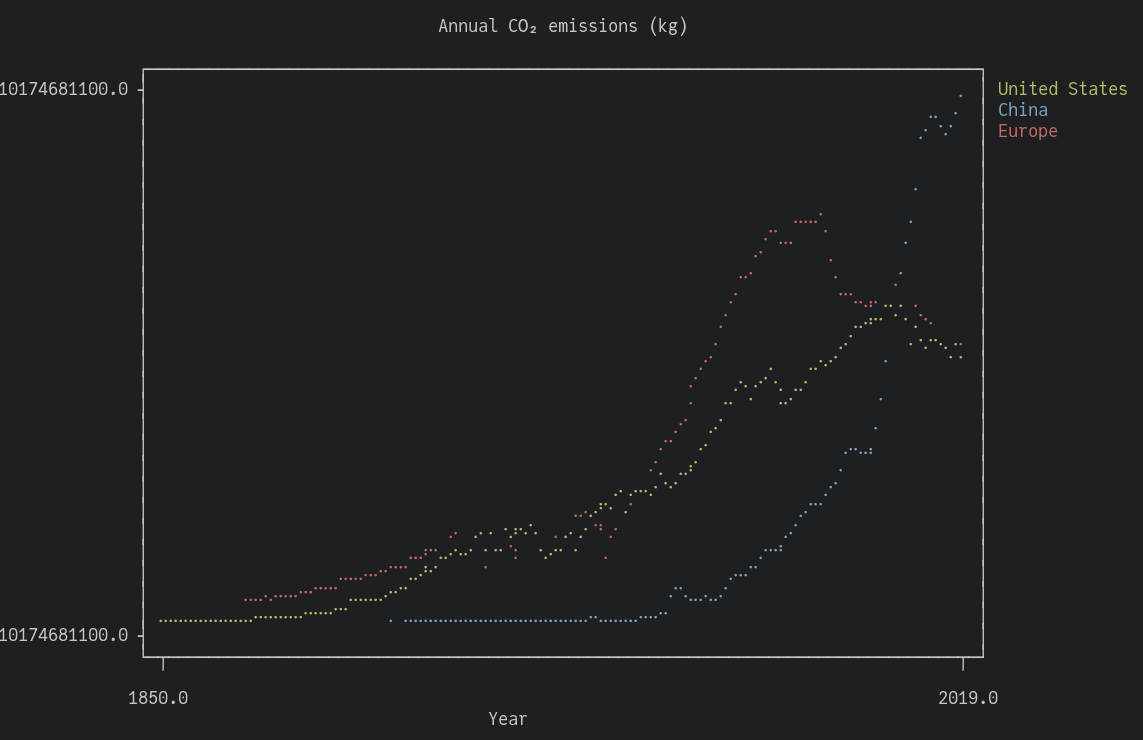
(source: Our World in Data)
Features
- Braille canvas for plotting
- Line plots
- Axes and tick labels showing ranges
- Optional title, x-axis label, and legend
- Input data loading from a CSV file
Usage
Start from a well-formatted CSV file:
$ head data/annual_co2_emissions.csv
Year,United States,China,France,Germany,Italy,United Kingdom
1750,,,,,,9.350528e6
1751,,,,,,9.350528e6
1752,,,,,,9.354192e6
1753,,,,,,9.354192e6
1754,,,,,,9.357856e6
1755,,,,,,9.36152e6
1756,,,,,,1.0006384e7
1757,,,,,,1.0010048e7
1758,,,,,,1.0013712e7
Uniplot reads the standard input for a CSV file, and its behaviour depends on the number of columns:
- If there is only one column, it will plot its values against a simple range index.
- For two or more columns, it will use the first column for the x-axis, and plot the next columns with different colors against it.
You can use a tool like Awk or xsv to select the columns you want to plot:
awk -F, -v OFS=, '{print $1, $4, $5, $6, $7}' data/annual_co2_emissions.csv | uniplot
And you can add a title by giving an argument to uniplot:
awk -F, -v OFS=, '{print $1, $4, $5, $6, $7}' data/annual_co2_emissions.csv | uniplot "Annual CO₂ emissions (kg)"Build
Install Gerbil Scheme.
Uniplot depends on Fancy for colors and display.
gxpkg install github.com/dlozeve/fancy
gxpkg install github.com/dlozeve/uniplot
Or manually clone Fancy and Uniplot and run ./build.ss in the root
directory of each repository.