Unicode plotting tool for displaying CSV data directly in your terminal
- optimized build - remove options with good default values (static is deprecated, optimize is #t by default) - lower debug level |
||
|---|---|---|
| images | ||
| uniplot | ||
| .gitignore | ||
| build.ss | ||
| gerbil.pkg | ||
| LICENSE | ||
| README.org | ||
| uniplot.ss | ||
Uniplot
Unicode plotting tool for displaying CSV data directly in your terminal.
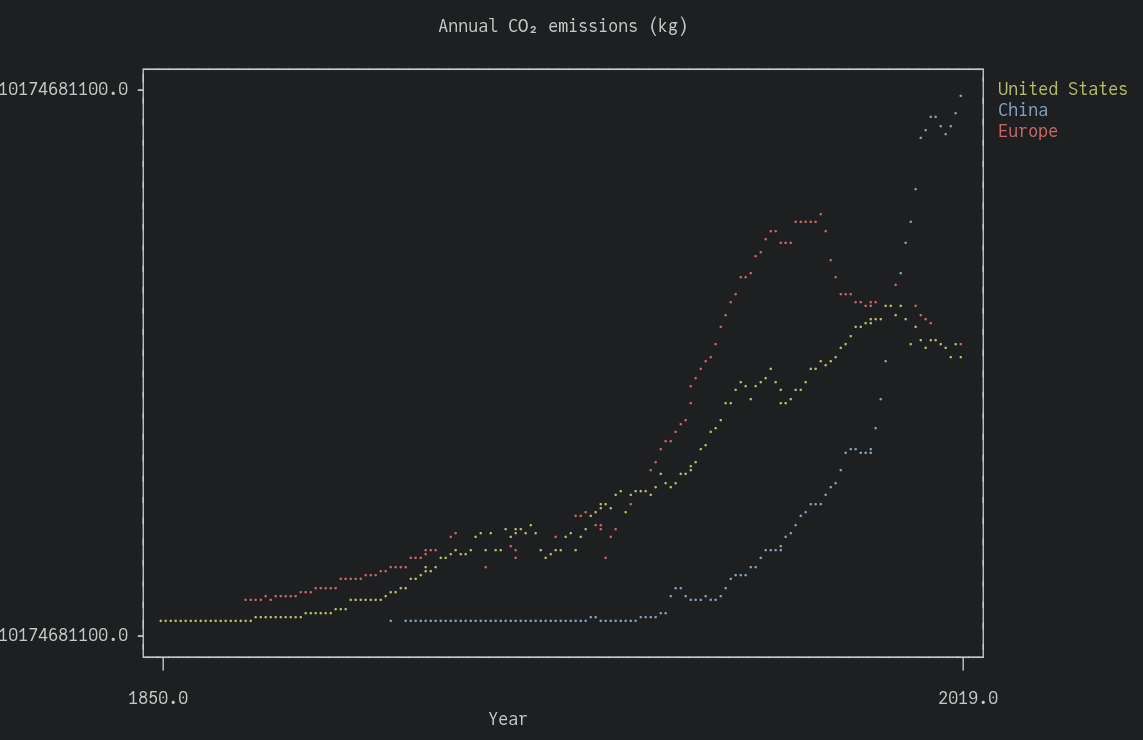
(source: Our World in Data)
Features
- Braille canvas for plotting
- Line plots
- Axes and tick labels showing ranges
- Optional title, x-axis label, and legend
- Input data loading from a CSV file
Usage
Start from a well-formatted CSV file:
$ head data/annual_co2_emissions.csv
Year,United States,China,France,Germany,Italy,United Kingdom
1750,,,,,,9.350528e6
1751,,,,,,9.350528e6
1752,,,,,,9.354192e6
1753,,,,,,9.354192e6
1754,,,,,,9.357856e6
1755,,,,,,9.36152e6
1756,,,,,,1.0006384e7
1757,,,,,,1.0010048e7
1758,,,,,,1.0013712e7
Uniplot reads the standard input for a CSV file, and its behaviour depends on the number of columns:
- If there is only one column, it will plot its values against a simple range index.
- For two or more columns, it will use the first column for the x-axis, and plot the next columns with different colors against it.
You can use a tool like Awk or xsv to select the columns you want to plot:
awk -F, -v OFS=, '{print $1, $4, $5, $6, $7}' data/annual_co2_emissions.csv | uniplot
And you can add a title by giving an argument to uniplot:
awk -F, -v OFS=, '{print $1, $4, $5, $6, $7}' data/annual_co2_emissions.csv | uniplot "Annual CO₂ emissions (kg)"Build
Install Gerbil Scheme.
Uniplot depends on Fancy for colors and display.
gxpkg install github.com/dlozeve/fancy
gxpkg install github.com/dlozeve/uniplot
Or manually clone Fancy and Uniplot and run ./build.ss in the root
directory of each repository.